Demandez à un dirigeant si la stratégie commerciale de son entreprise est claire pour ses collaborateurs, il vous dira « oui ! » sans aucune hésitation.
Maintenant, demandez à un de ses commerciaux s’il connait la raison pour laquelle il doit obtenir ses 5 rendez-vous par semaine, la réponse sera bien moins claire !
Cette différence de perception traduit d’un challenge auquel vous êtes sûrement confronté.e : faire adhérer vos équipes à votre stratégie commerciale.
Car l’atteinte de vos objectifs dépend de la mise en œuvre de votre stratégie d’entreprise par vos collaborateurs.
Comment alors faire percevoir à vos équipes les intérêts de cette stratégie et faire appliquer cette dernière sur le terrain ?
L’une des erreurs les plus fréquentes quand on aborde sa stratégie de vente avec ses commerciaux est de se focaliser uniquement sur les résultats obtenus.
Pourquoi ? Car on ne peut plus agir sur les résultats ! Ils ne représentent que la partie visible de l’activité commerciale.
On peut, cependant, agir sur les différentes actions commerciales menant à ces résultats.
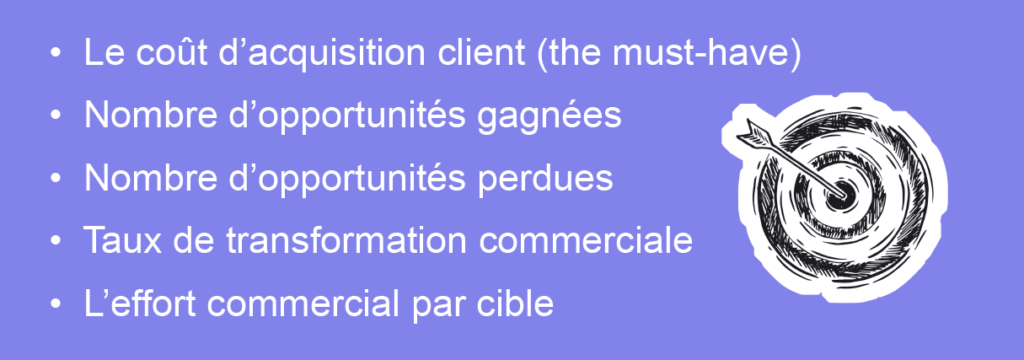
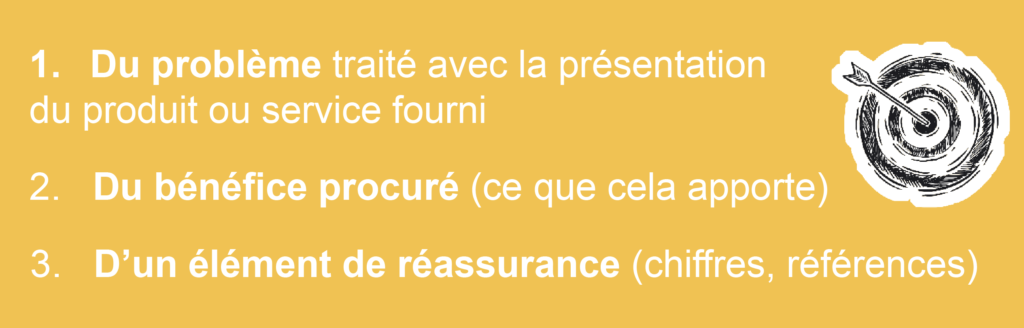
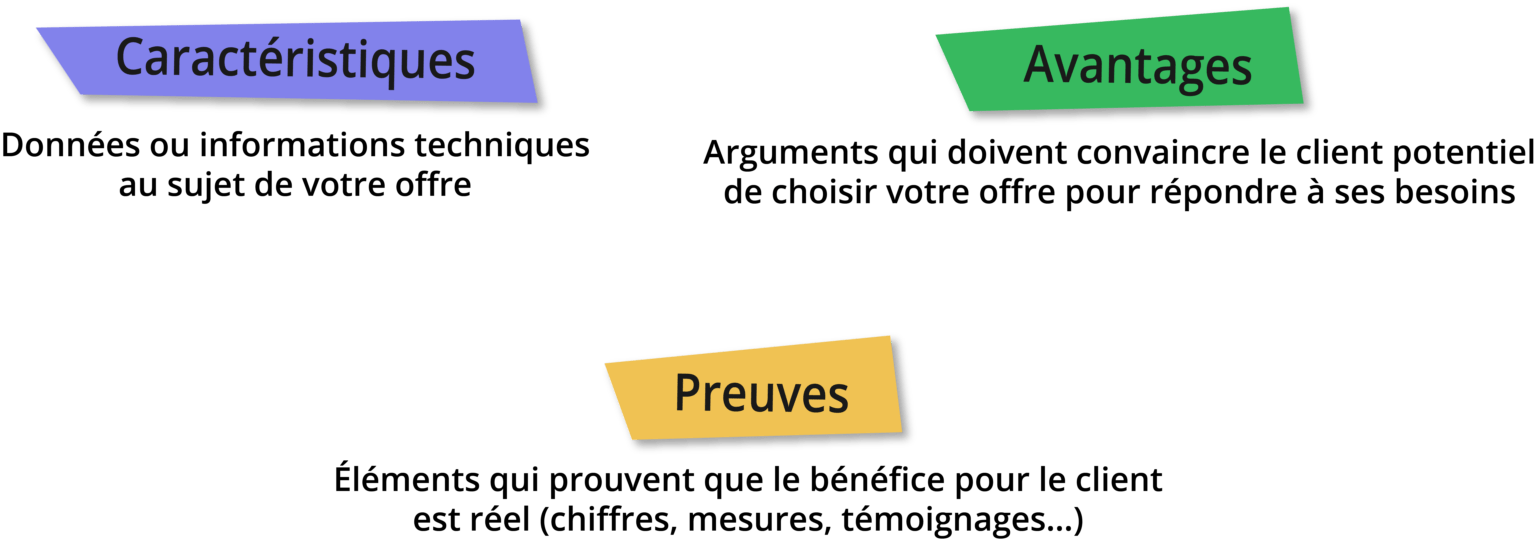
La mise en œuvre d’un Plan d’Action Commercial va ainsi vous permettre de définir 3 leviers essentiels à votre activité commerciale, traduisant votre stratégie :
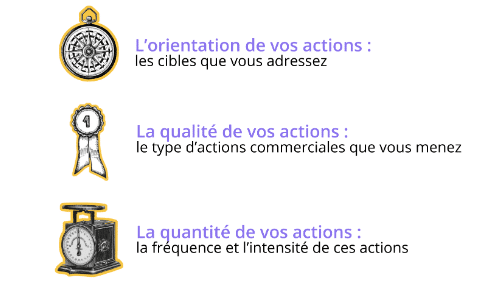
En vous concentrant sur les actions commerciales de vos équipes, vous délivrez ainsi à vos commerciaux deux éléments clés : du sens concernant votre stratégie et des moyens concrets pour atteindre les objectifs établis.
Car c’est une chose de demander à vos commerciaux de vendre 5 000 exemplaires de votre produit phare… C’en est une autre pour vos équipes d’atteindre cet objectif.
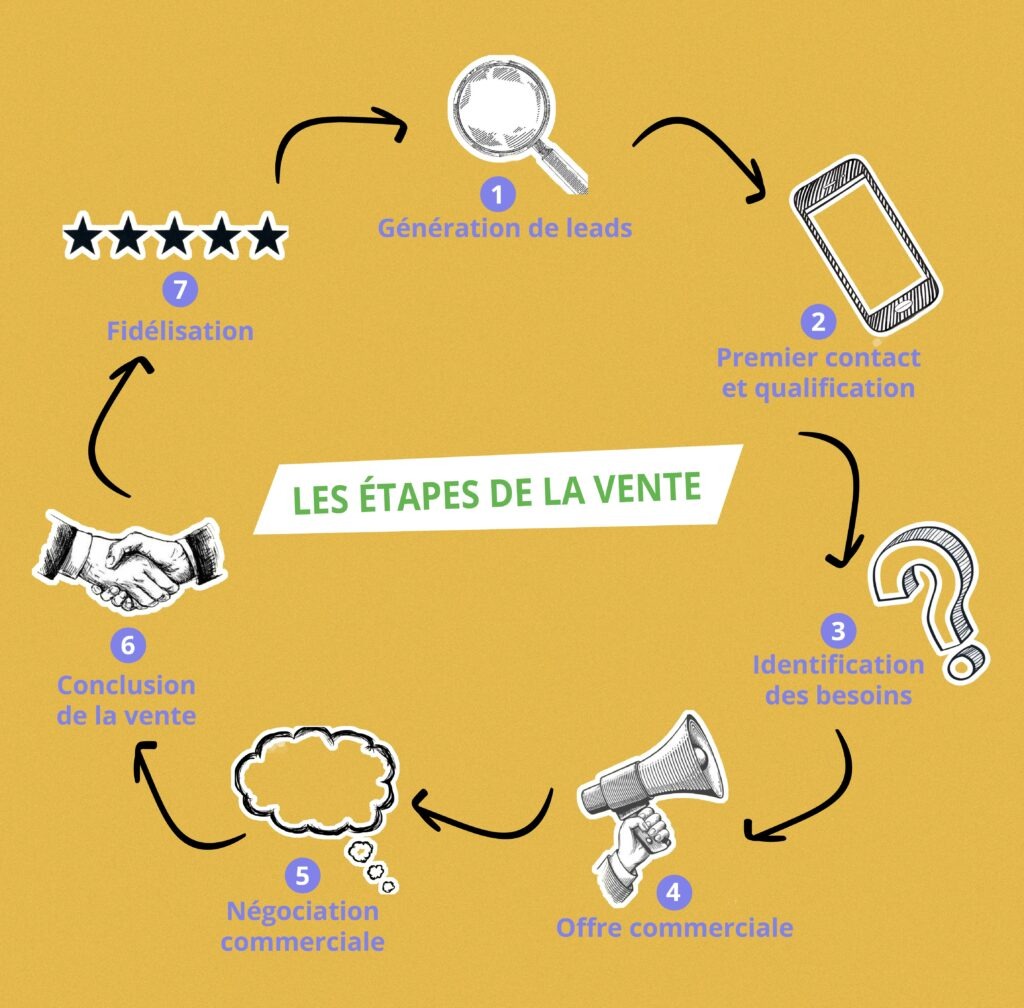
En détaillant les étapes de votre processus de vente et en y associant des activités commerciales concrètes, vous aidez ainsi vos collaborateurs à identifier leurs points forts et leurs axes d’amélioration.
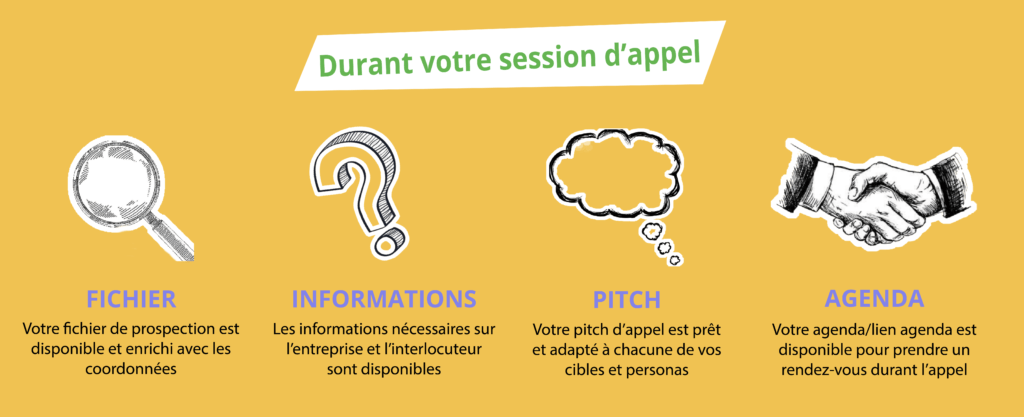
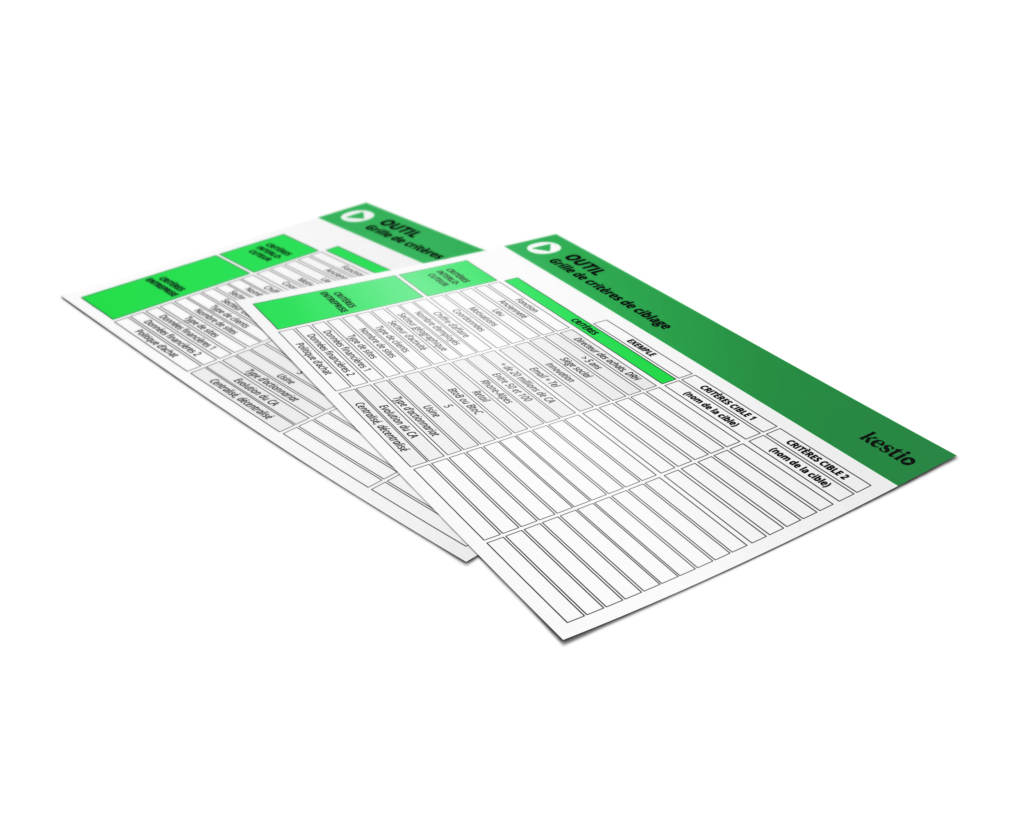
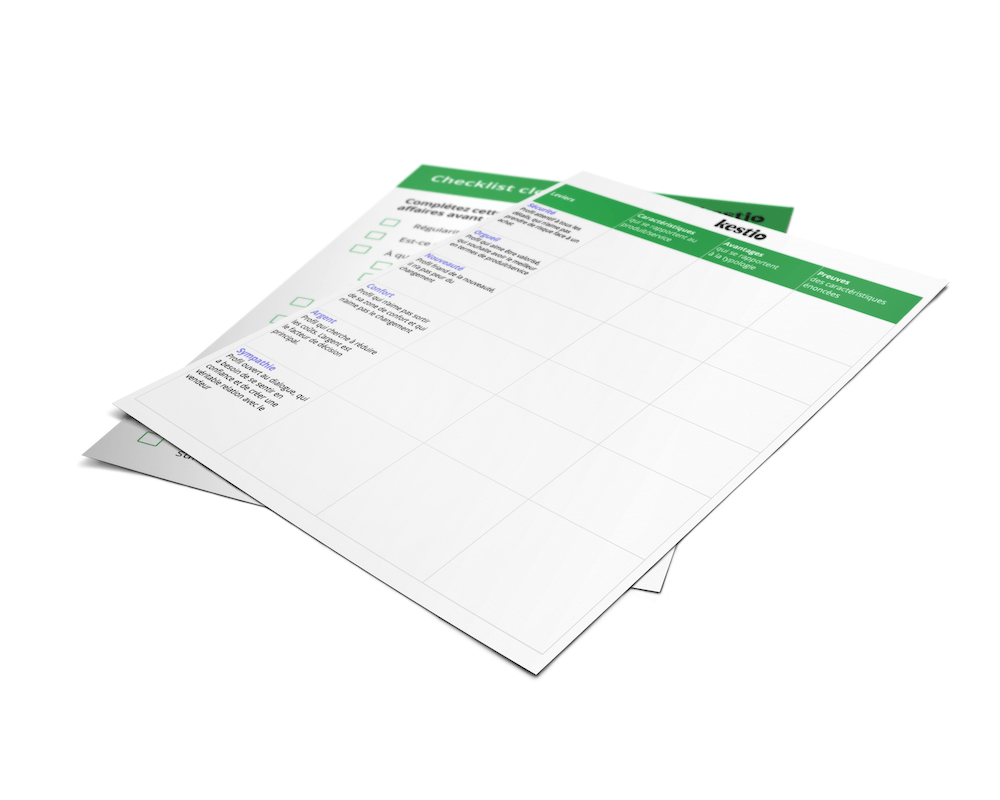
Pour permettre à vos équipes d’optimiser leurs efforts commerciaux, nous vous partageons notre tableau scoring « Go/No go ».
Cet outil à compléter au quotidien vous aide à sélectionner les opportunités ayant le plus de potentiel grâce à différents critères reprenant les grandes étapes d’un processus de vente !
Télécharger le tableau de scoring
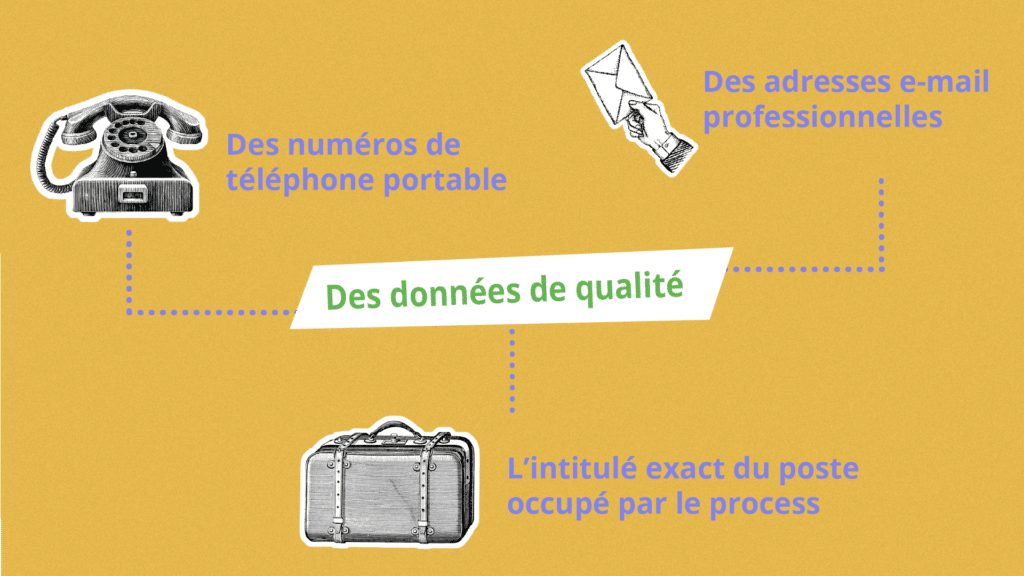
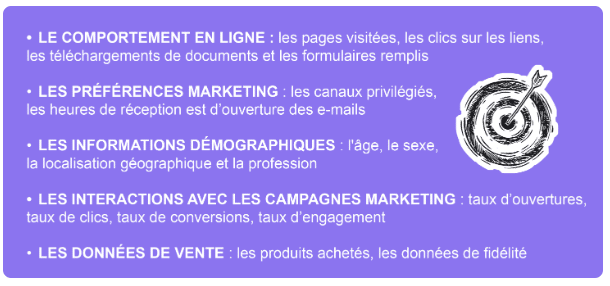
Aujourd’hui les attentes clients ont beaucoup évolué en matière de vente. Influencés par les changements technologiques et les habitudes d’achat, les clients sont de plus en plus exigeants et ont des attentes qui incluent :
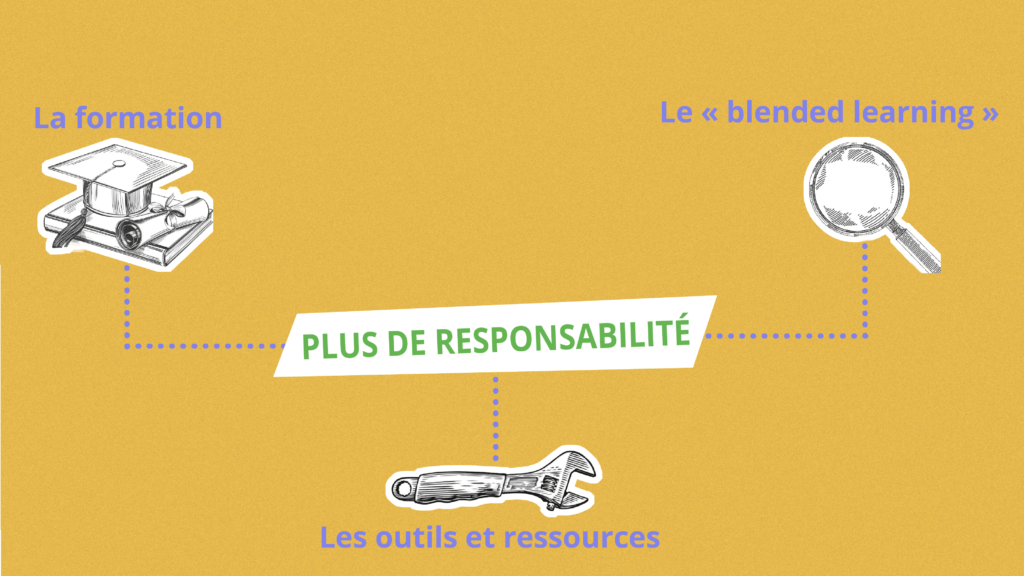
Dans cette perspective, il est important pour les commerciaux de s’adapter à ces nouvelles attentes pour maintenir leur pertinence et leur compétitivité sur le marché. Valorisez ainsi les ressources que vous mettez à la disposition des commerciaux, pour qu’ils puissent appliquer la stratégie commerciale sur le terrain.
Dressez la liste de ces ressources avec deux objectifs : d’une part, les faire connaitre à vos commerciaux pour qu’ils s’en emparent, et d’autre part, booster leur motivation en leur montrant que l’entreprise investit pour leur donner les moyens d’atteindre les résultats visés.
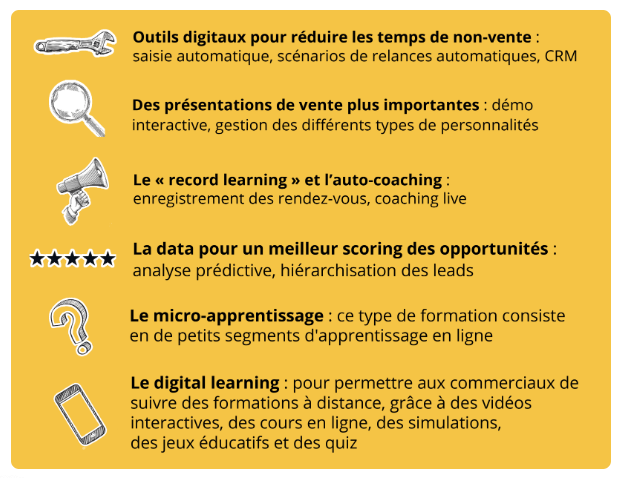
Chez Kestio, notre équipe digital learning propose des modules de formation interactifs et engageants pour répondre aux attentes personnalisées de nos clients. Si cela semble encore flou pour vous, découvrez une vidéo présentant notre approche.
Et si cela vous intéresse, vous pouvez échanger avec l’un de nos experts en digital learning !
Echanger avec une expert en
digital learning
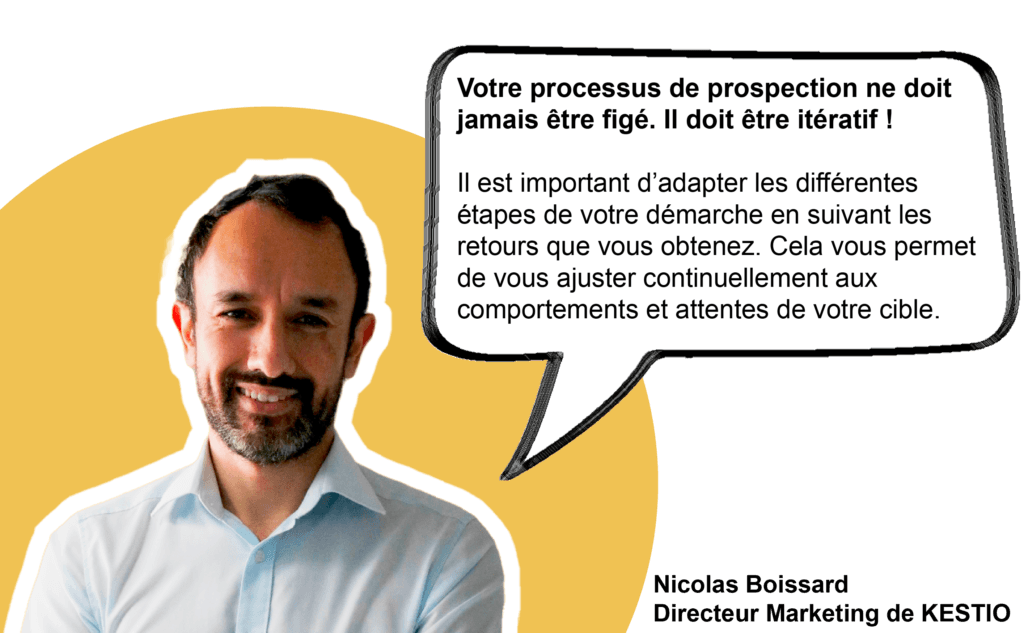
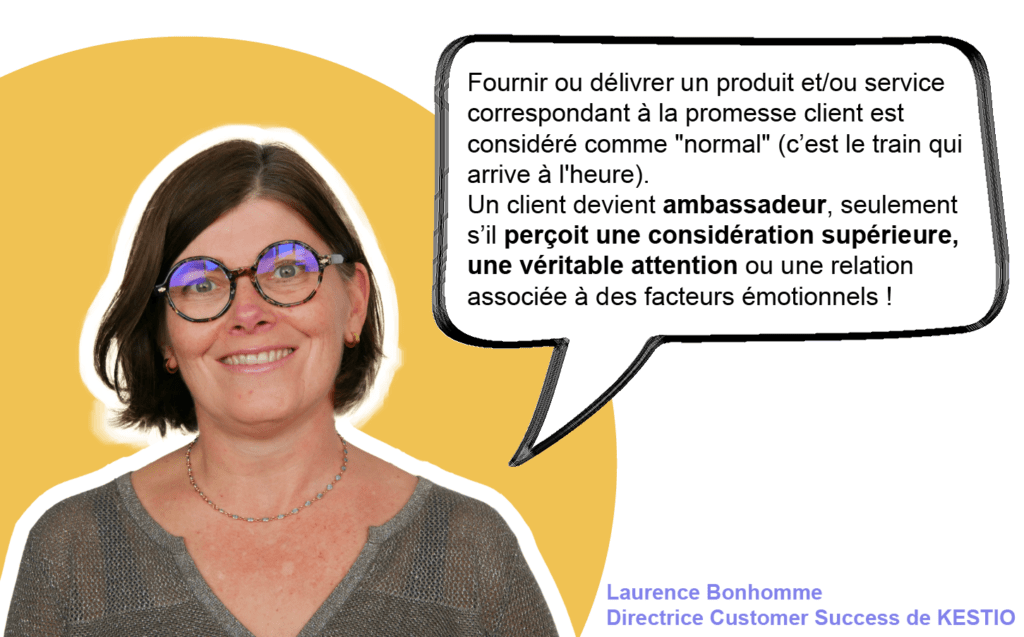
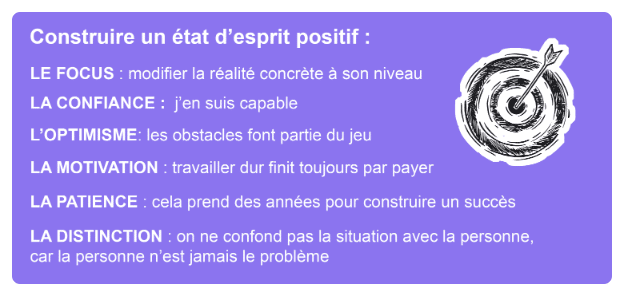
L’état d’esprit des équipes commerciales joue un rôle clé dans l’atteinte de leurs objectifs . Une attitude positive et peut conduire à des négociations réussies et à la satisfaction des clients.
Le rôle du manager sera de donner un élan positif à son équipe , en célébrant les succès et en offrant des perspectives positives pour le futur. Cela peut être accompli en demandant à l’équipe leurs victoires de la semaine, en échangeant sur les nouveautés qui ont fonctionné, en étant empathique avec les membres de l’équipe et en allant chercher le non-dit
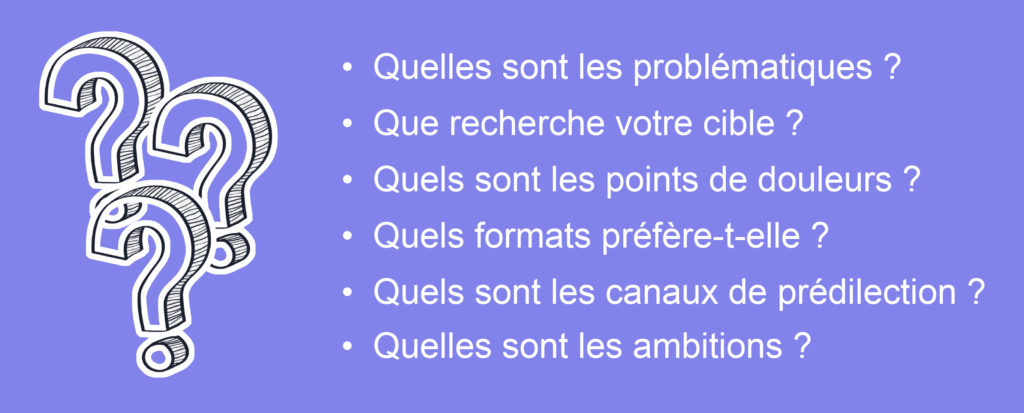
Rattachez la stratégie commerciale et les objectifs des prochains mois aux victoires remportées sur l’année écoulée, en vous posant les questions suivantes :
Webinar – Quels leviers de motivation adopter pour
chaque collaborateur ?
Une entreprise perd en moyenne 10% de ses clients chaque année ! Si les causes peuvent être variées (plus de besoin à résoudre, déception de la prestation, départ pour la concurrence…), le résultat est le même : votre entreprise doit trouver une solution pour compenser ces départs et ne pas perdre en chiffre d’affaires.
Lorsque l’on connaît l’investissement nécessaire pour acquérir de nouveaux clients, la réactivation de vos anciens clients représente alors une démarche stratégique ! Car même s’ils ne font plus appel à vos besoins, ceux-ci connaissent déjà votre entreprise, votre expertise, vos méthodes de travail.
Ils seront ainsi plus enclins à collaborer à nouveau avec vous pour un futur projet. Nous vous livrons donc aujourd’hui les étapes à suivre pour arriver à réactiver vos anciens clients !

Pour mettre en place une campagne efficace de réactivation client, vous devez pouvoir identifier clairement quels clients ont quitté votre entreprise.
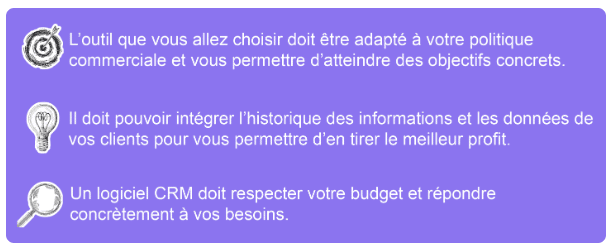
Pour cela, l’utilisation quotidienne d’un CRM vous sera indispensable. Il vous permettra d’obtenir une vision globale de l’historique de vos clients : de quand datent leurs dernières transactions ? Comment se sont passés vos derniers échanges ?
En utilisant les différents filtres de ciblage de votre CRM, notamment sur la date d’activité de vos clients, vous pourrez ainsi identifier vos clients inactifs.
Et grâce aux données de contact récoltées pour chaque client, vous pourrez ainsi personnaliser vos campagnes de réactivation selon leurs attentes.
Si vous avez besoin d’aide pour identifier vos clients perdus au sein de votre CRM, découvrez notre webinar “Kestions-Réponses” spécial CRM !
Découvrir le webinar
“Kestions-Réponses”CRM
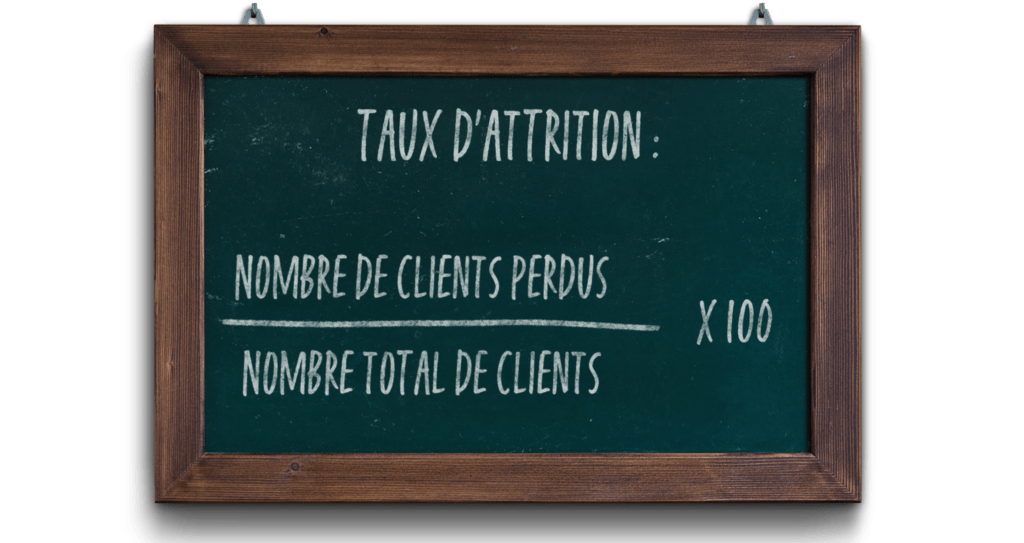
Grâce à votre CRM, vous pourrez notamment calculer votre taux d’attrition.
Aussi appelé « churn rate », le taux d’attrition désigne le pourcentage de clients perdus par rapport à votre nombre total de clients
| Une fois l’ampleur de votre taux d’attrition mesurée, vous pourrez enquêter sur les raisons de ces départs et mettre en place votre stratégie de reconquête ! |
Étape indispensable d’une approche marketing pertinente, la proposition de valeur est la formulation simple et précise de la plus-value d’un produit ou service perçue par le client.
Autrement dit, elle démontre la rentabilité (économies réalisées, revenus générés) de la solution proposée, et rassure sur les risques liés à ce projet. En rendant votre proposition unique, elle permet de vous différencier de vos concurrents, et de faciliter le processus d’achat de votre client.
Si la proposition de valeur n’est pas clairement identifiée par le client, elle peut être la cause de sa perte. Si vous êtes dans ce cas, il est donc essentiel de retravailler la formulation.
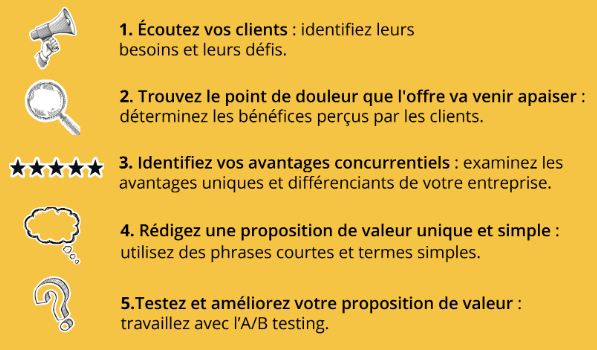
Votre offre est-elle comprise par la clientèle cible ?
Ses différences sont-elles claires ?
Les membres de votre entreprise sont-ils en capacité d’en parler facilement ?
Ce sont ces questions qui permettent d’identifier si votre proposition de valeur est efficace !
Télécharger le canvas
Proposition de valeur
Le coût d’acquisition d’un nouveau client est plus élevé que celui de la réactivation d’anciens clients. Il peut être alors plus efficace pour les entreprises de récupérer des clients perdus. Pour cela, le marketing relationnel apparaît comme une stratégie intéressante pour renouer le contact et développer une relation privilégiée et durable.
L’objectif sera de comprendre les besoins spécifiques des clients, leurs préférences et leurs comportements, pour les inciter à nouveau à vous faire confiance et assurer l’avenir d’un service client exceptionnel.
En utilisant ces techniques de marketing relationnel pour reconquérir des clients perdus, vous pourrez par la même occasion améliorer votre taux de fidélisation et réduire les coûts de acquisition de nouveaux clients.
Echanger avec un expert du
Marketing relationnel